Fig.5
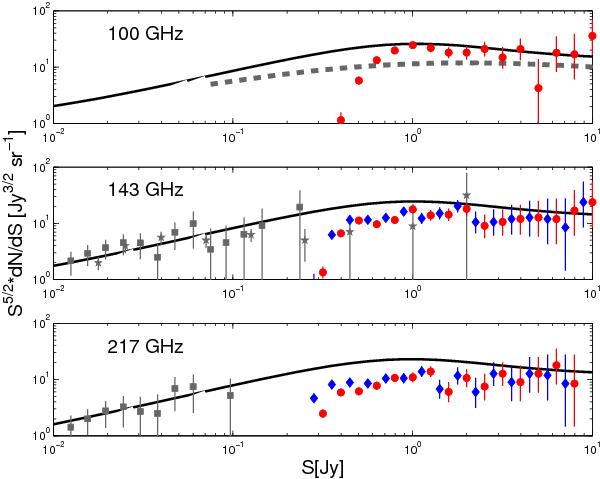
Euclidean normalized differential number counts at the HFI frequencies (100, 143, and 217 GHz). The red circles with Poisson error bars show the counts of sources with counterparts in our reference 30 GHz sample. At 143 and 217 GHz the blue diamonds (shifted to the left by half of the bin size, for clarity) show the counts obtained after removing sources with 143–217 GHz spectral index indicative of dust emission (see Sect. 2.3.2). Again, in each panel, the solid curves show the total number counts of extragalactic radio sources predicted by the de Zotti et al. (2005) evolution model. Also shown are the SPT (grey squares; Vieira et al. 2010) and ACT (grey stars; Marriage et al. 2011, counts of radio sources. At 100 GHz we also show the estimated counts by Sadler et al. (2008) from follow-up observations of a sample of sources selected from the 20 GHz ATCA survey (grey dashed line).
Current usage metrics show cumulative count of Article Views (full-text article views including HTML views, PDF and ePub downloads, according to the available data) and Abstracts Views on Vision4Press platform.
Data correspond to usage on the plateform after 2015. The current usage metrics is available 48-96 hours after online publication and is updated daily on week days.
Initial download of the metrics may take a while.