Fig.3
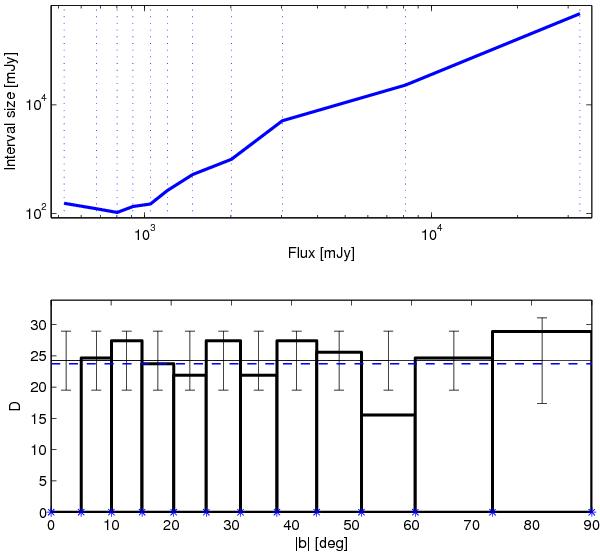
Completeness and uniformity tests at 30 GHz. Top panel: flux density interval, or bin size, including a fixed number of sources as a function of flux density. The change of slope at about 0.9Jy signals the onset of incompleteness. Bottom panel: uniformity test for sources with flux densities Sν ≥ 1.0Jy. The source density, D, in sources per sr, within regions at different Galactic latitudes, shows an acceptable uniformity. The horizontal grey (solid) and blue (dashed) lines show the average source density at Galactic latitudes above |b| = 5 and |b| = 30°, respectively. As it is apparent, the two values are very close to each other, within the 1σ level calculated for the overall population in the two sky areas considered here, and well inside the 1σ normalized Poisson error bars. We also checked that at flux densities below about 0.9–1.0Jy statistically more relevant deviations from a uniform distribution begin to appear.
Current usage metrics show cumulative count of Article Views (full-text article views including HTML views, PDF and ePub downloads, according to the available data) and Abstracts Views on Vision4Press platform.
Data correspond to usage on the plateform after 2015. The current usage metrics is available 48-96 hours after online publication and is updated daily on week days.
Initial download of the metrics may take a while.