Fig. 7
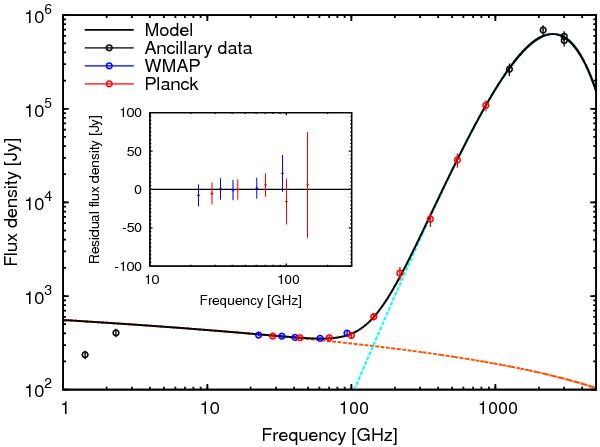
Spectrum of the Orion nebula (M42) Hii region using aperture photometry. The model consists of optically thin free-free emission (orange dashed line) and thermal dust emission (light blue dashed line). The inner panel shows the residual spectrum after removal of the model, indicating the consistency between Planck and WMAP data.
Current usage metrics show cumulative count of Article Views (full-text article views including HTML views, PDF and ePub downloads, according to the available data) and Abstracts Views on Vision4Press platform.
Data correspond to usage on the plateform after 2015. The current usage metrics is available 48-96 hours after online publication and is updated daily on week days.
Initial download of the metrics may take a while.