Fig.6
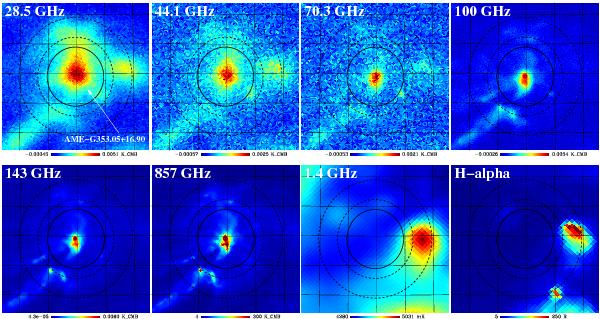
Maps of the ρ Ophiuchi molecular cloud region at their original angular resolution. From left to right, top row: Planck 28.5; 44.1; 70.3; and 100 GHz. Bottom row: Planck 143 and 857 GHz; 1.4 GHz; and Hα. The maps cover 5° × 5° centred on  and have linear colour scales. The graticule has 1° spacing in Galactic coordinates. The circular aperture and background annulus, which were used to calculate the flux density (see text), are indicated. The strong AME is evident at 28.5 and 44.1 GHz.
Current usage metrics show cumulative count of Article Views (full-text article views including HTML views, PDF and ePub downloads, according to the available data) and Abstracts Views on Vision4Press platform.
Data correspond to usage on the plateform after 2015. The current usage metrics is available 48-96 hours after online publication and is updated daily on week days.
Initial download of the metrics may take a while.