Free Access
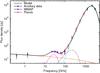
Fig.14
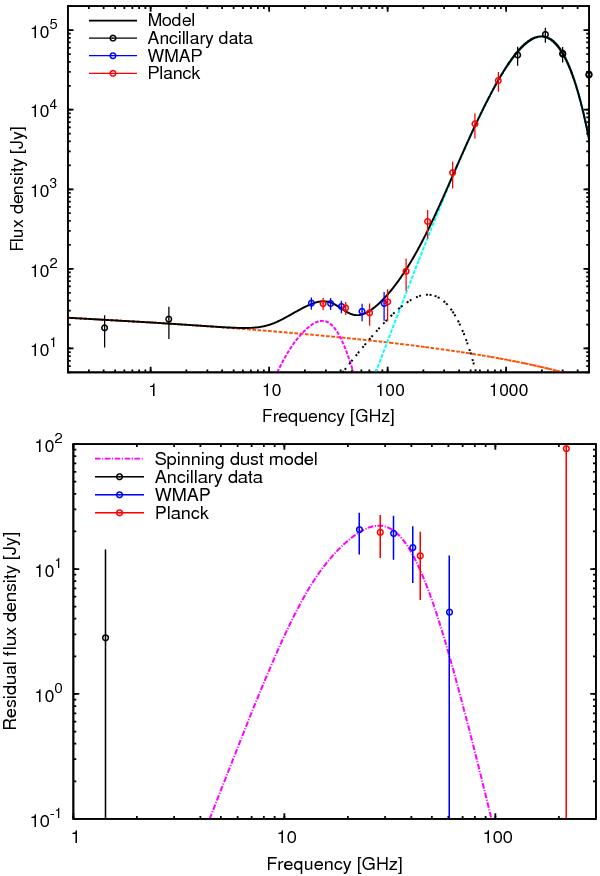
The spectrum (top) and residuals (bottom) for AME-G107.1+5.2 after removing free-free (orange dashed line), thermal dust emission (light blue dashed line) and CMB anisotropies (black double-dotted line). A spinning dust model is shown as a magenta dot-dashed line.
This figure is made of several images, please see below:
Current usage metrics show cumulative count of Article Views (full-text article views including HTML views, PDF and ePub downloads, according to the available data) and Abstracts Views on Vision4Press platform.
Data correspond to usage on the plateform after 2015. The current usage metrics is available 48-96 hours after online publication and is updated daily on week days.
Initial download of the metrics may take a while.