Free Access
Fig.7
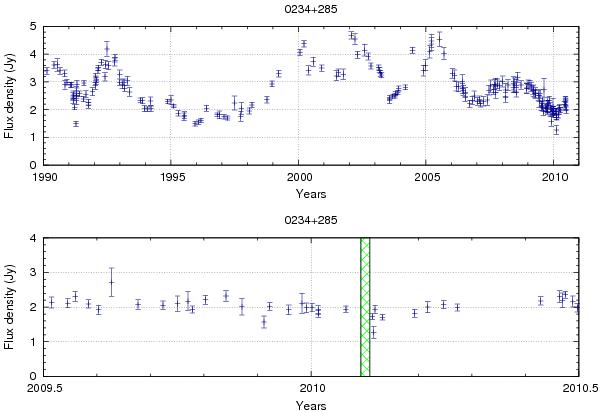
The 37 GHz lightcurve of 0234+285, measured at Metsähovi Radio Observatory, showing continuous variability. The period when Planck was observing the source is indicated by the hatched region in the lower panel, which is a blow-up of the last year.
Current usage metrics show cumulative count of Article Views (full-text article views including HTML views, PDF and ePub downloads, according to the available data) and Abstracts Views on Vision4Press platform.
Data correspond to usage on the plateform after 2015. The current usage metrics is available 48-96 hours after online publication and is updated daily on week days.
Initial download of the metrics may take a while.