Fig. 8
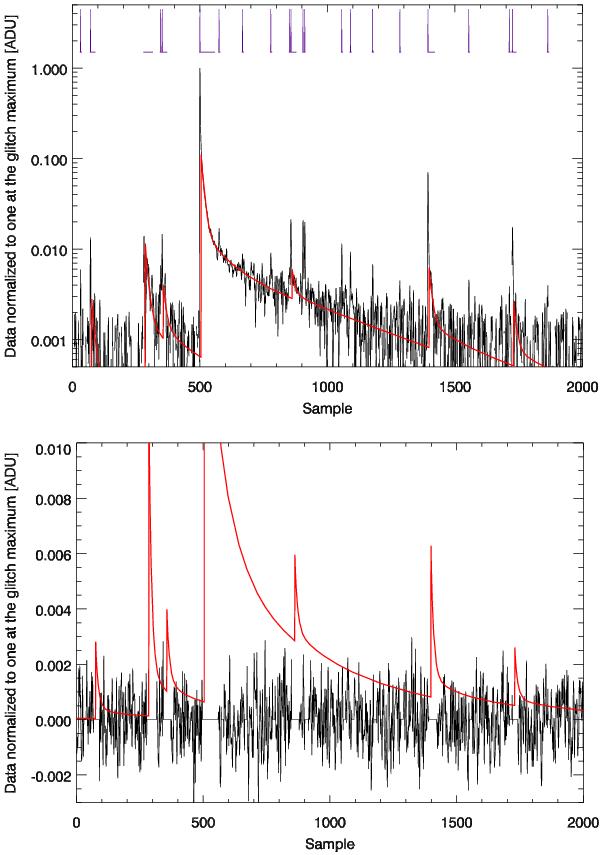
Top panel: example of 2000 samples of sky subtracted data encompassing a large event in black and our best fit glitch templates (red). The purple ticks in the upper part of the figure show where data are flagged and indicate the detected position of glitches. Bottom panel: the cleaned residual in black (with the flagged areas set to zero) compared with the fitted template in red.
Current usage metrics show cumulative count of Article Views (full-text article views including HTML views, PDF and ePub downloads, according to the available data) and Abstracts Views on Vision4Press platform.
Data correspond to usage on the plateform after 2015. The current usage metrics is available 48-96 hours after online publication and is updated daily on week days.
Initial download of the metrics may take a while.