Fig. D.1
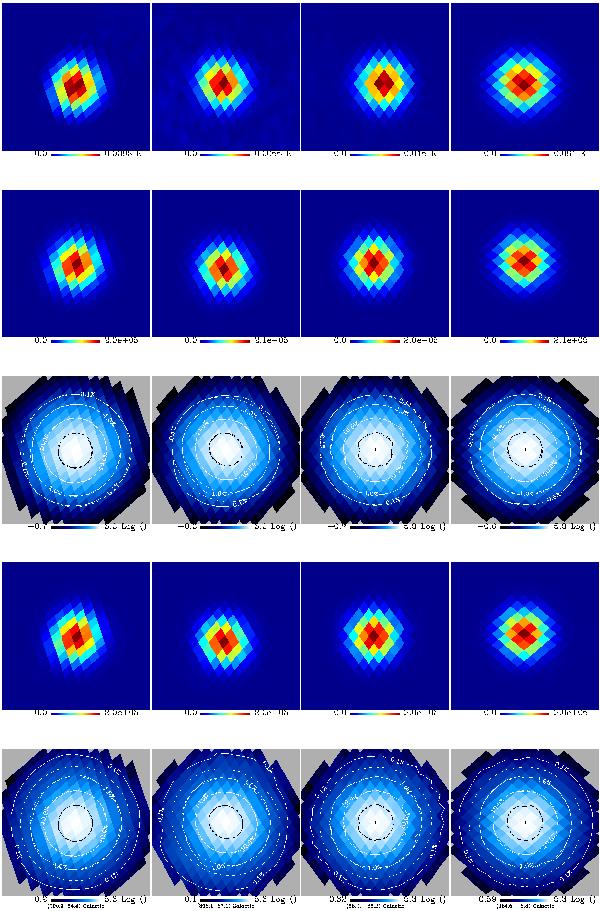
Images obtained at 143 GHz. Each column corresponds to one of four sources. a) The first row displays a zoom of the 143 GHz map around each source. b) The second row shows the FEBeCoP beam at that location, as computed when using the elliptical Gaussian description of the scanning beam derived from Mars observations. c) The third row shows on a logarithmic scale the same Point Spread Functions (PSF) with superimposed iso-contours shown in solid line, to be compared with elliptical Gaussian fit iso-contours shown in broken line. d) The fourth row shows the FEBeCoP beam at that location, as in b), when using instead the Gauss-Hermite description of the scanning beam in input. e) The fifth row shows as in c) the PSF on a logarithmic scale, for the Gauss-Hermite input.
Current usage metrics show cumulative count of Article Views (full-text article views including HTML views, PDF and ePub downloads, according to the available data) and Abstracts Views on Vision4Press platform.
Data correspond to usage on the plateform after 2015. The current usage metrics is available 48-96 hours after online publication and is updated daily on week days.
Initial download of the metrics may take a while.