Fig. C.3
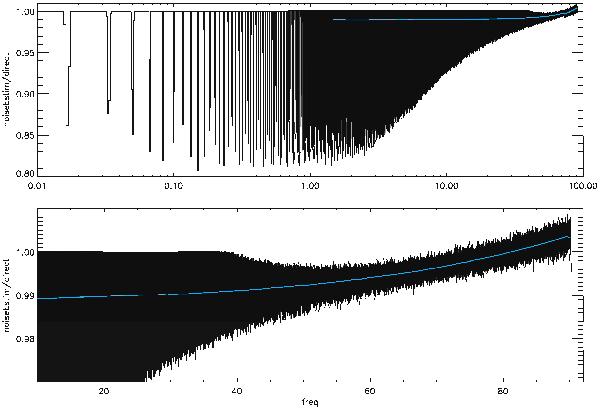
Ratio of the power spectra obtained on the noise estimator timeline to that from the input noise timeline. Top: on a logarithmic frequency scale, to emphasise the effect at low frequency. Bottom: on a linear frequency scale. The blue line is the same spectrum smoothed to 1 Hz resolution to show the mean value of the bias.
Current usage metrics show cumulative count of Article Views (full-text article views including HTML views, PDF and ePub downloads, according to the available data) and Abstracts Views on Vision4Press platform.
Data correspond to usage on the plateform after 2015. The current usage metrics is available 48-96 hours after online publication and is updated daily on week days.
Initial download of the metrics may take a while.