Fig. 21
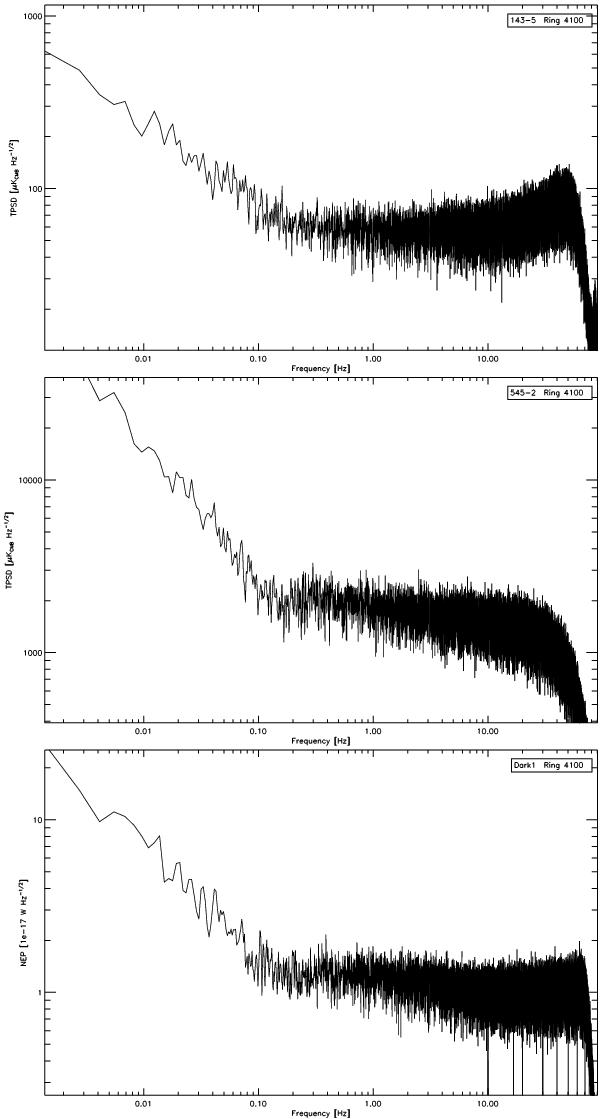
Examples of noise power spectra for the bolometers 143-5 (top), 545-2 (middle), and Dark1 (bottom). The first two have been calibrated in CMB temperature units, by using the calibration coefficients derived during the map making step. The last spectrum is in Watts. The central region shows a nearly white noise plateau, with a low frequency “1/f” component, and a high frequency cut-off due to the filtering of frequencies above the sampling frequency. At 143 GHz, the upturn due to the deconvolution of the (bolometer dependent) temporal transfer function is clearly seen (see details in Sect. 4.6).
Current usage metrics show cumulative count of Article Views (full-text article views including HTML views, PDF and ePub downloads, according to the available data) and Abstracts Views on Vision4Press platform.
Data correspond to usage on the plateform after 2015. The current usage metrics is available 48-96 hours after online publication and is updated daily on week days.
Initial download of the metrics may take a while.