Fig. 20
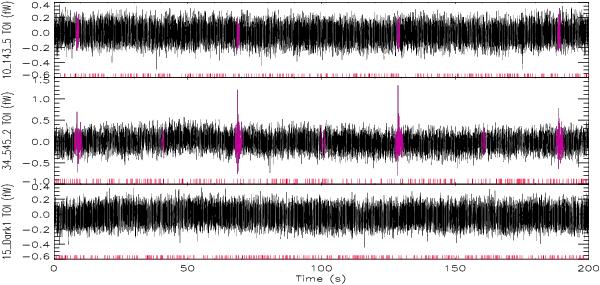
Processed TOI as in Fig. 19, but with the ring averaged signal subtracted to enhance features near the noise limit. Times where data are flagged, are shown by the red lines at the bottom of each plot. Purple zones show where the strong signal flag is set and where the phase-bin ring average subtraction is not expected to yield a perfect cancellation of the signal.
Current usage metrics show cumulative count of Article Views (full-text article views including HTML views, PDF and ePub downloads, according to the available data) and Abstracts Views on Vision4Press platform.
Data correspond to usage on the plateform after 2015. The current usage metrics is available 48-96 hours after online publication and is updated daily on week days.
Initial download of the metrics may take a while.