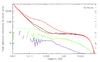
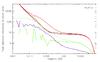
Fig. 13

Power spectra of the residual noise in simulations after template subtraction and flagging (in black) for one bolometer (PSB-a) at 143 GHz (top panel) and one SWB at 217 GHz (bottom panel). Both bolometers have high rates of long glitches. No other processing has been applied to the simulations, except a 3-point filter (as applied to real data before deglitching), the effect of which can be seen at frequencies above 10 Hz. This can be compared with the surrounding red curves. The top red curves in both plots correspond to the power spectra of the simulated data (pure noise+glitches) before template subtraction The lower red curves correspond to the power spectra of the pure noise TOIs used in generating the simulations. The green dashed curves are the power spectra of the residual glitches remaining after flagging and template subtraction, which are measured from the difference between the estimated and the input TOIs of glitches. Those curves are not exactly equivalent to the difference between the black and the bottom red curves because some noise is subtracted by the template subtraction process. The green curves are the cross-spectra between the input TOIs of glitches and the cleaned data, and the blue curves show the cross-spectra between the recovered TOIs of glitches (which are subtracted from data) and the input noise TOIs.
Current usage metrics show cumulative count of Article Views (full-text article views including HTML views, PDF and ePub downloads, according to the available data) and Abstracts Views on Vision4Press platform.
Data correspond to usage on the plateform after 2015. The current usage metrics is available 48-96 hours after online publication and is updated daily on week days.
Initial download of the metrics may take a while.