Free Access
Fig. 3
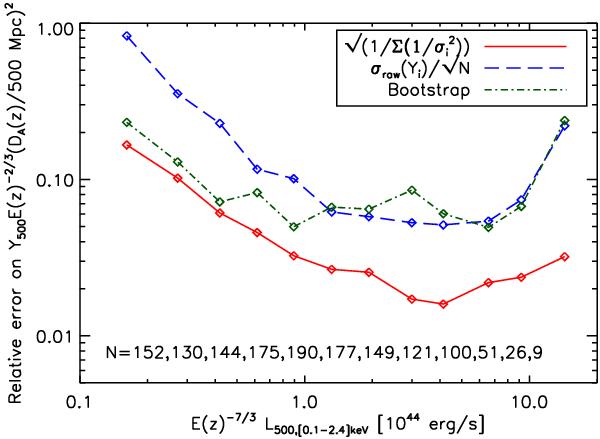
Bin averaged relative statistical errors (solid line) and relative bootstrap errors (dot-dashed line) are shown as a function of X-ray luminosity. The numbers given in the legend indicate the number of objects in each luminosity bin. For comparison, the scaled unweighted standard deviation (dashed line) is also shown.
Current usage metrics show cumulative count of Article Views (full-text article views including HTML views, PDF and ePub downloads, according to the available data) and Abstracts Views on Vision4Press platform.
Data correspond to usage on the plateform after 2015. The current usage metrics is available 48-96 hours after online publication and is updated daily on week days.
Initial download of the metrics may take a while.