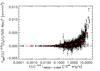
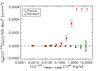
Fig. 2

Left: intrinsic SZ signal from a sphere of radius R500 as a function of the X-ray luminosity for all the clusters in the sample individually. Error bars indicate the pure measurement uncertainties based on MMF noise estimates (statistical uncertainties). Red diamonds show the bin averaged values with thick and thin error bars indicating the statistical (not visible) and bootstrap uncertainties, respectively. Right: zoom onto the scale indicated by the horizontal dotted lines in the left-hand panel. Red symbols and error bars as in left-hand panel. Green triangles (shifted towards lower X-ray luminosity values by 20% with respect to diamonds for clarity) show the result of the same analysis when the signal is estimated at random positions instead of true cluster positions. The associated thick error bars indicate the statistical uncertainties.
Current usage metrics show cumulative count of Article Views (full-text article views including HTML views, PDF and ePub downloads, according to the available data) and Abstracts Views on Vision4Press platform.
Data correspond to usage on the plateform after 2015. The current usage metrics is available 48-96 hours after online publication and is updated daily on week days.
Initial download of the metrics may take a while.