Fig. 20
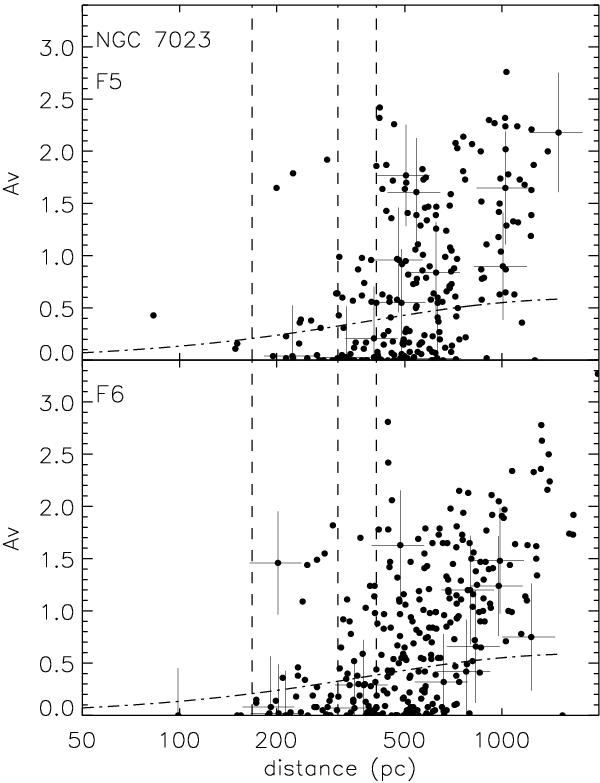
The AV vs. d plot for the stars classified as dwarfs from the individual fields F5 (upper panel) and F6 (lower panel) towards NGC 7023. The dashed vertical lines are drawn at 168 pc, 310 pc, and 408 pc inferred from the procedure described in Sect. 2 (see Fig. 3). The dash-dotted curve represents the increase in extinction towards the Galactic latitude b = + 14.1° as a function of distance based on the expressions given by BS80. The error bars are shown for only a few stars to ensure that the points can be seen more clearly.
Current usage metrics show cumulative count of Article Views (full-text article views including HTML views, PDF and ePub downloads, according to the available data) and Abstracts Views on Vision4Press platform.
Data correspond to usage on the plateform after 2015. The current usage metrics is available 48-96 hours after online publication and is updated daily on week days.
Initial download of the metrics may take a while.