Fig. 1
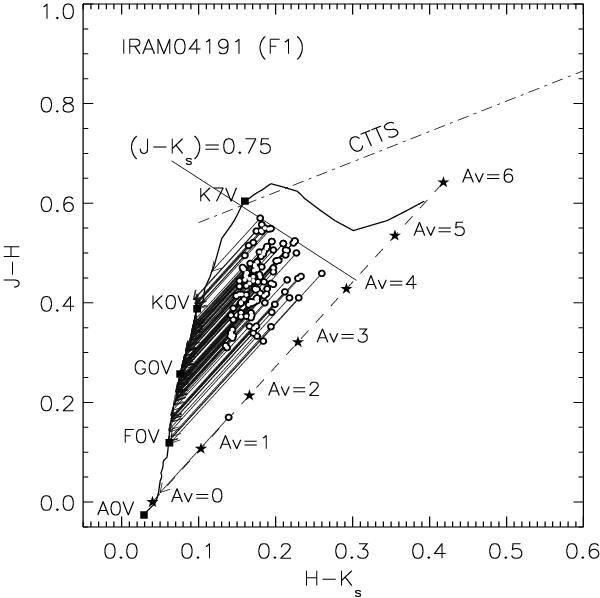
The (J − H) vs. (H − Ks) CC diagram drawn for stars (with AV ≥ 1) from the region F1 towards IRAM 04191 (see Fig. 4) to illustrate the method. The solid curve represents the locations of unreddened main-sequence stars. The reddening vector for an A0V type star drawn parallel to the Rieke & Lebofsky (1985) interstellar reddening vector is shown by the dashed line. The locations of the main-sequence stars of different spectral types are marked with square symbols. The region to the right of the reddening vector is known as the NIR excess region and corresponds to the location of PMS sources. The dash-dot-dash line represents the loci of unreddened CTTSs (Meyer et al. 1997). The line (J − Ks) ≤ 0.75 is the upper limit set to eliminate M-type stars from the analysis as unreddened M-type stars located across the reddening vectors of A0-K7 dwarfs make it difficult to differentiate the reddened A0-K7 dwarfs from the unreddened M-type stars. The circles represent the observed colours and the arrows are drawn from the observed to the final colours obtained by the method for each star.
Current usage metrics show cumulative count of Article Views (full-text article views including HTML views, PDF and ePub downloads, according to the available data) and Abstracts Views on Vision4Press platform.
Data correspond to usage on the plateform after 2015. The current usage metrics is available 48-96 hours after online publication and is updated daily on week days.
Initial download of the metrics may take a while.