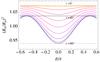
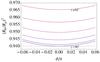
Fig. B.1
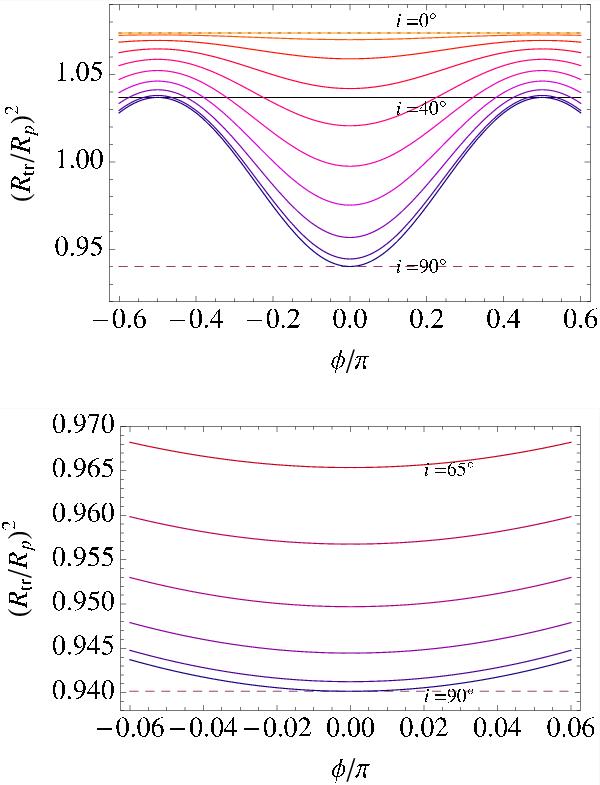
Normalized projected area of the planet as a function of its anomaly (φ) for inclinations of the orbit going from i = 90° (lowest curve) to i = 0° (highest curve) in steps of 10◦ (5◦ for bottom panel) for a WASP-12 b analog on a circular orbit. Top: for the full orbit. Bottom: zoom on the (primary or secondary) transit. The ordinates of the dotted, solid, and dashed horizontal lines are  (face-on orbit),
  , and
, and  , respectively.
Current usage metrics show cumulative count of Article Views (full-text article views including HTML views, PDF and ePub downloads, according to the available data) and Abstracts Views on Vision4Press platform.
Data correspond to usage on the plateform after 2015. The current usage metrics is available 48-96 hours after online publication and is updated daily on week days.
Initial download of the metrics may take a while.