Fig. 8
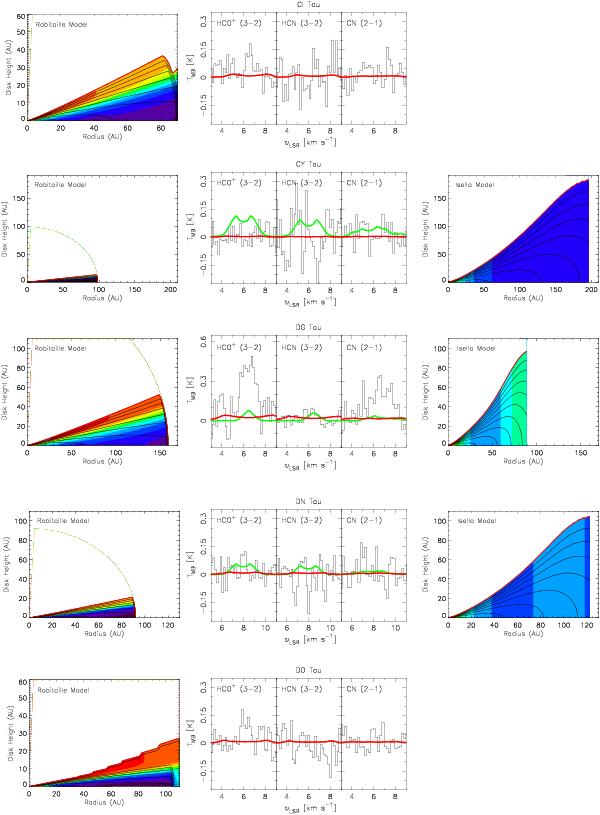
Results of the general analysis. From left to right: the Robitaille disk structure; the line predictions for HCO+, HCN, and CN (in red for the Robitaille model, green for the Isella model); and the Isella disk structure (when available). The sources from top to bottom are: CI Tau, CY Tau, DG Tau, DN Tau, and DO Tau. For the disk structures, filled contours correspond to the temperature profile (in K). The temperature levels are identical for all disks, designated at: 10, 15, 20, 25, 30, 35, 40, 45, 50, 55, 60, 75, 100, 150, and 250 K. A color bar is provided in Fig. 9. The contour lines indicate the log H2 number density (in cm-3), indicated at whole number integrals from 3 (disk surface/edge) to 12 (typical midplane density). Models are only pictured for the disks included in the Robitaille and Isella samples. (Color plots are available online.)
Current usage metrics show cumulative count of Article Views (full-text article views including HTML views, PDF and ePub downloads, according to the available data) and Abstracts Views on Vision4Press platform.
Data correspond to usage on the plateform after 2015. The current usage metrics is available 48-96 hours after online publication and is updated daily on week days.
Initial download of the metrics may take a while.