Fig. 7
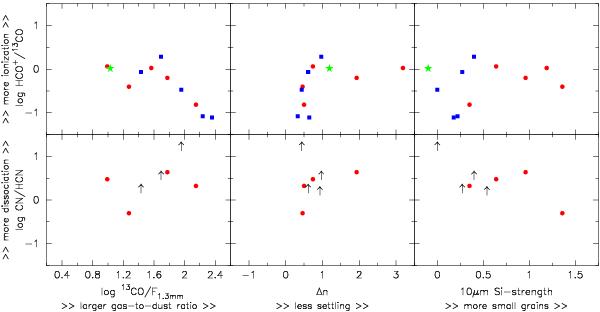
Upper panels: the degree of ionization (traced by HCO+/13CO) versus the gas-to-dust ratio (13CO/F1.3mm), the difference in the mid-infrared spectral slope between 6, 10, and 25 μm (Δn), and the strength of the 10 μm silicate emission feature. Lower panels: similar plots for the photodissociation effect (traced by CN/HCN). See Fig. 5 for an explanation of the symbols. (Color plots are available online.)
Current usage metrics show cumulative count of Article Views (full-text article views including HTML views, PDF and ePub downloads, according to the available data) and Abstracts Views on Vision4Press platform.
Data correspond to usage on the plateform after 2015. The current usage metrics is available 48-96 hours after online publication and is updated daily on week days.
Initial download of the metrics may take a while.