Fig. 5
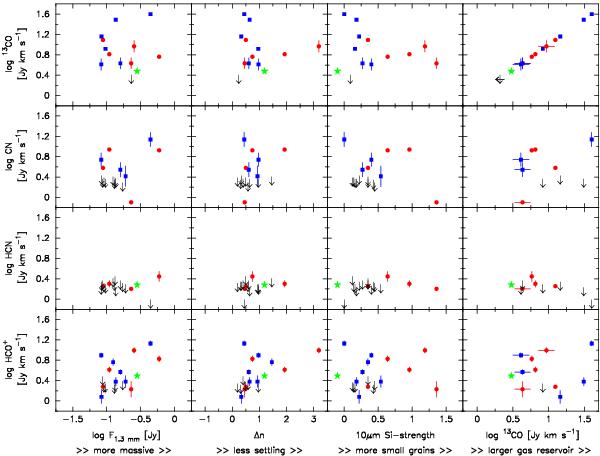
A log plot of the integrated line intensities in Jy km s-1 versus several disk parameters that probe the total dust mass (F1.3mm), dust settling via the mid-infrared spectral slope (Δn), amount of small grains via the 10 μm silicate emission feature strength (Si-strength), and the total gas mass (inferred from the 13CO line flux). Blue squares represent our JCMT observations, red circles represent data from the literature, and black arrows are used to indicate all upper limits. A green star symbol represents T Tau, whose line emission is contaminated by a large remnant envelope in the single-dish data plotted. The upper-right panel illustrates the dynamic range of the available gas reservoirs. (Color plots are available online.)
Current usage metrics show cumulative count of Article Views (full-text article views including HTML views, PDF and ePub downloads, according to the available data) and Abstracts Views on Vision4Press platform.
Data correspond to usage on the plateform after 2015. The current usage metrics is available 48-96 hours after online publication and is updated daily on week days.
Initial download of the metrics may take a while.