Fig. 4
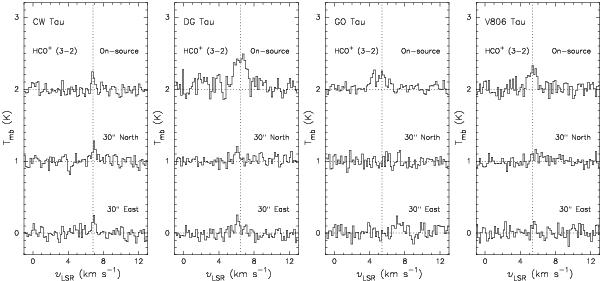
From left to right, the HCO+ (J = 3–2) on-source and 30′′ offset observations for CW Tau, DG Tau, GO Tau, and V806 Tau. These 4 sources show the strongest HCO+ emission profiles in our subsample. A dotted line marks the central radial velocity υLSR in km s-1 for a Gaussian fit to the HCO+ on-source emission. In all cases, HCO+ emission is detected at the off positions. However, with the exception of CW Tau, it is always at a separate velocity or a weaker intensity, which is why we attribute the emission toward CW Tau to the surrounding cloud and not the disk.
Current usage metrics show cumulative count of Article Views (full-text article views including HTML views, PDF and ePub downloads, according to the available data) and Abstracts Views on Vision4Press platform.
Data correspond to usage on the plateform after 2015. The current usage metrics is available 48-96 hours after online publication and is updated daily on week days.
Initial download of the metrics may take a while.