Fig. 2
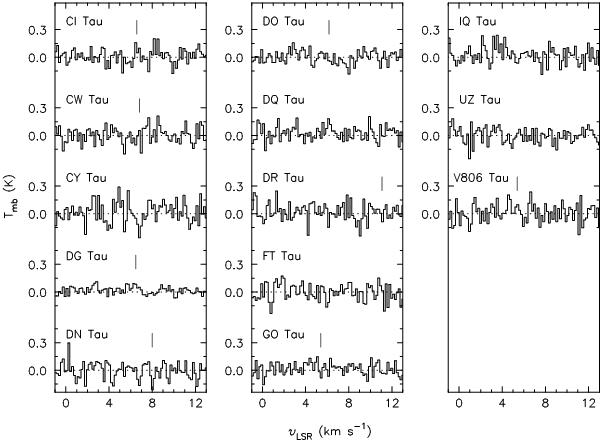
HCN (J = 3–2) observations of our subsample in Taurus. A vertical line above the spectrum indicates the central velocity found from the detected HCO+ emission in Fig. 1, except for DR Tau where the detected CN emission velocity is used instead. We note that HCN emission is not detected toward any of the sources, including the most massive disk DG Tau.
Current usage metrics show cumulative count of Article Views (full-text article views including HTML views, PDF and ePub downloads, according to the available data) and Abstracts Views on Vision4Press platform.
Data correspond to usage on the plateform after 2015. The current usage metrics is available 48-96 hours after online publication and is updated daily on week days.
Initial download of the metrics may take a while.