Free Access
Fig. 13
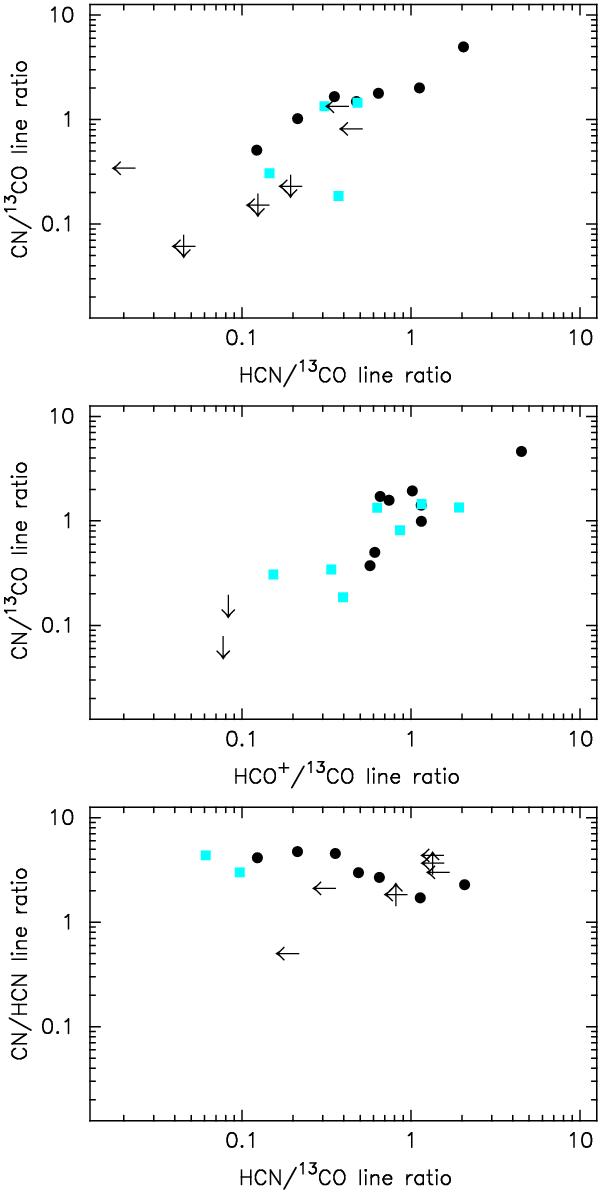
Integrated intensity line ratios for HCO+, HCN, CN, and 13CO plotted alongside other disk systems around PMS stars in the literature. Circles represent data points extracted from Fig. 3 of (Kastner et al. 2008b), squares represent data points from our complete Taurus sample, and black arrows represent upper/lower limits.
Current usage metrics show cumulative count of Article Views (full-text article views including HTML views, PDF and ePub downloads, according to the available data) and Abstracts Views on Vision4Press platform.
Data correspond to usage on the plateform after 2015. The current usage metrics is available 48-96 hours after online publication and is updated daily on week days.
Initial download of the metrics may take a while.