Fig. 12
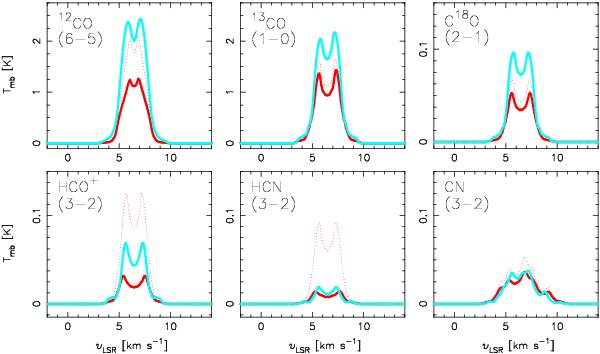
Similar to Figs. 8 and 9, the line predictions for the two models for the inner 160 AU, assuming identical abundances, Tkin, M⋆, and i, in order to uniformly compare the predicted emission. A solid blue line represents the Robitaille solution, whilst a red line is the Isella prediction. The corresponding temperature and density structures are given in Fig. 11. In addition, as a dashed red line, we plot the most extreme solution to the Isella model, based on the provided error bars and the largest possible fractional abundances predicted for disks. For both models, the inner 160 AU structure emits only a small fraction of the total emission necessary to recreate the observed lines, but the two predictions are very similar.
Current usage metrics show cumulative count of Article Views (full-text article views including HTML views, PDF and ePub downloads, according to the available data) and Abstracts Views on Vision4Press platform.
Data correspond to usage on the plateform after 2015. The current usage metrics is available 48-96 hours after online publication and is updated daily on week days.
Initial download of the metrics may take a while.