Fig. 1
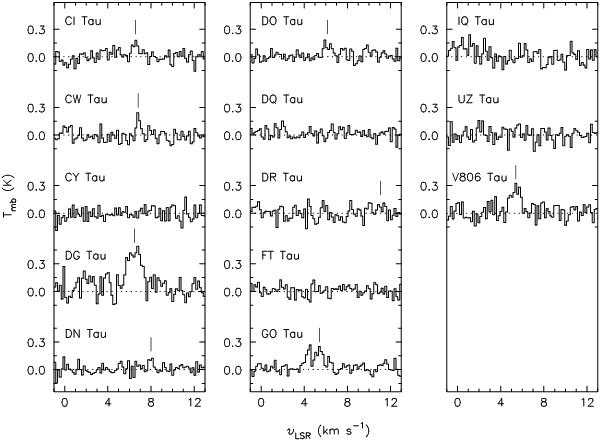
HCO+ (J = 3–2) observations of our 13-disk subsample in Taurus. A vertical line above the spectrum indicates the central radial velocity υLSR for the detected emission, as determined from a Gaussian fit to the emission profile. In the case of the non-detection toward DR Tau, we indicate the expected υLSR based on our fit to its CN emission profile in Fig. 3.
Current usage metrics show cumulative count of Article Views (full-text article views including HTML views, PDF and ePub downloads, according to the available data) and Abstracts Views on Vision4Press platform.
Data correspond to usage on the plateform after 2015. The current usage metrics is available 48-96 hours after online publication and is updated daily on week days.
Initial download of the metrics may take a while.