Free Access
Fig. 3
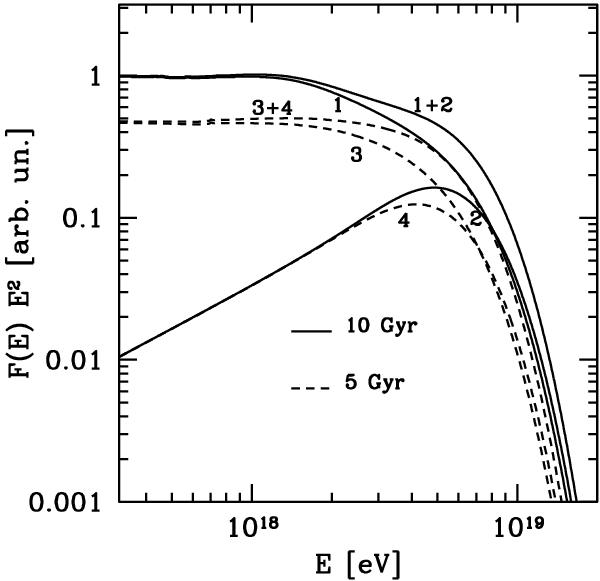
Spatially integrated spectra for the proton distributions in Fig. 2 for an accelerator age of 10 Gyr (solid lines) and 5 Gyr (dashed lines). The lines 1 and 3 represent the downstream contributions, 2 and 4 the upstream ones, and 1+2 and 3+4 the sum of each pair.
Current usage metrics show cumulative count of Article Views (full-text article views including HTML views, PDF and ePub downloads, according to the available data) and Abstracts Views on Vision4Press platform.
Data correspond to usage on the plateform after 2015. The current usage metrics is available 48-96 hours after online publication and is updated daily on week days.
Initial download of the metrics may take a while.