Fig. 2
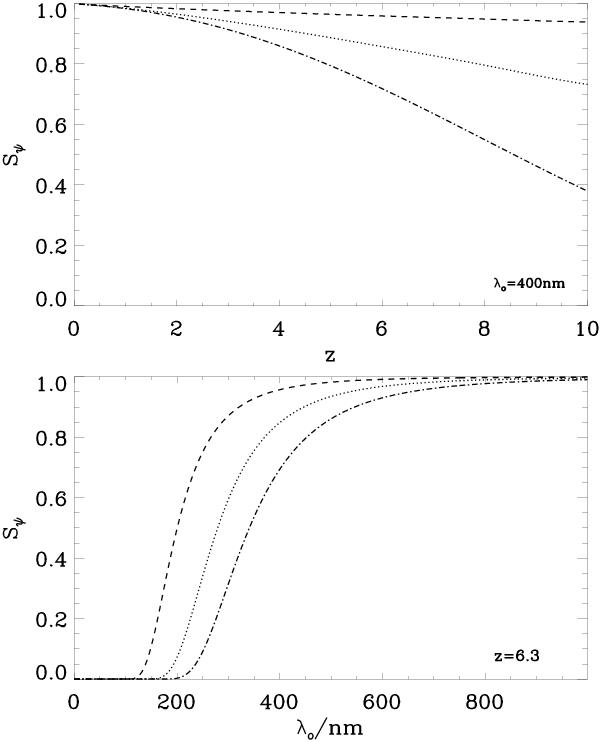
Expected Strehl ratio as a function of redshift (top) and wavelength (bottom). In both plots, we assume α = 2/3 and N = 1.8. In the top figure we examine the change in Strehl ratio expected for a point source with varying redshift, z, for an observed wavelength of 400 nm. In the bottom plot, we specifically show the case of a z = 6.3 quasar, as examined by Tamburini et al. (2011), for an observed wavelength of 400 nm. As in Fig. 1, the dashed line refers to the use of comoving distance, dotted line refers to the naive use of luminosity distance, and dash-dot line refers to the treatment in Eq. (9).
Current usage metrics show cumulative count of Article Views (full-text article views including HTML views, PDF and ePub downloads, according to the available data) and Abstracts Views on Vision4Press platform.
Data correspond to usage on the plateform after 2015. The current usage metrics is available 48-96 hours after online publication and is updated daily on week days.
Initial download of the metrics may take a while.