Fig. 1

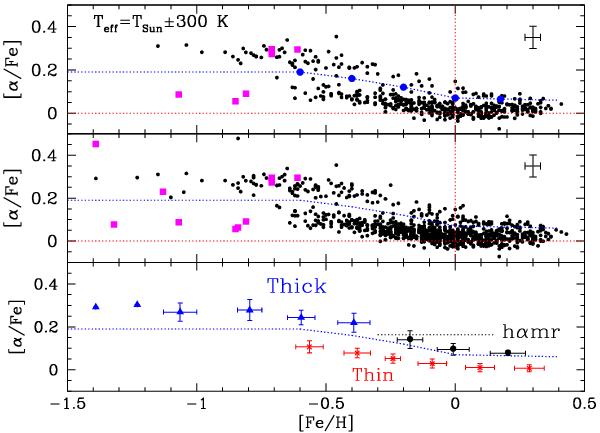
[α/Fe] versus [Fe/H] for the whole sample (middle) and for stars with Teff = T⊙ ± 300 K (top). Magenta squares refer to halo stars. Blue filled circles are the separation points between low- and high-α stars, which are minimas of the [α/Fe] histograms for five metallicity bins (from [Fe/H] = −0.7 to 0.25) and the blue dashed curve is the corresponding separation curve passing on that points. The bottom panel is the [α/Fe] versus [Fe/H] plot for the whole sample in several bins of metallicity. The blue triangles refer to the thick disk stars, black filled circles to the metal-rich high-α stars (hαmr), and the red crosses to the thin disk stars. Error bars in the lower panel correspond to the standard deviations, and the error bar in the upper and middle panels are the average errors in the [α/Fe] and [Fe/H].
Current usage metrics show cumulative count of Article Views (full-text article views including HTML views, PDF and ePub downloads, according to the available data) and Abstracts Views on Vision4Press platform.
Data correspond to usage on the plateform after 2015. The current usage metrics is available 48-96 hours after online publication and is updated daily on week days.
Initial download of the metrics may take a while.


