Fig. 4
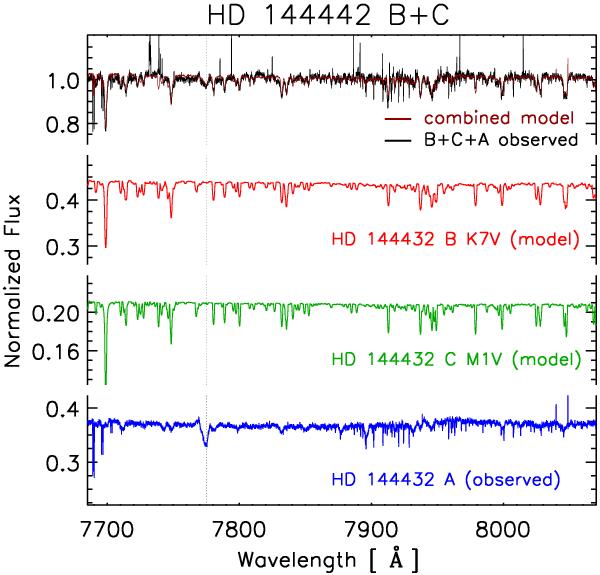
Upper spectra: observed normalized FEROS spectrum at the position HD 144432 B and C (in black), and the normalized synthetic combined model that most closely describes the observed spectrum (in red). Lower spectra: relative contributions of HD 144432 B, C, and the contamination from HD 144432 A (note the difference in the Y-axis for each spectrum). The vertical dotted line displays the absorption line of HD 144432 A used to scale the flux of HD 144432 A to match the observed spectrum. The strength of the contamination from the A component is similar to the flux of HD 144432 B.
Current usage metrics show cumulative count of Article Views (full-text article views including HTML views, PDF and ePub downloads, according to the available data) and Abstracts Views on Vision4Press platform.
Data correspond to usage on the plateform after 2015. The current usage metrics is available 48-96 hours after online publication and is updated daily on week days.
Initial download of the metrics may take a while.