Free Access
Fig. 7
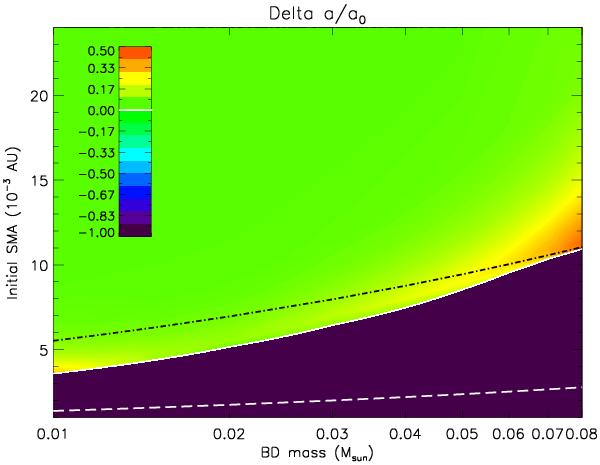
Map of Δa/a0 for a range of initial semi-major axis and different BD masses. Each BD has the same initial rotation velocity. The dashed dotted line is the corotation distance at the beginning of integration and the dashed line is the Roche limit.
Current usage metrics show cumulative count of Article Views (full-text article views including HTML views, PDF and ePub downloads, according to the available data) and Abstracts Views on Vision4Press platform.
Data correspond to usage on the plateform after 2015. The current usage metrics is available 48-96 hours after online publication and is updated daily on week days.
Initial download of the metrics may take a while.