Fig. 10
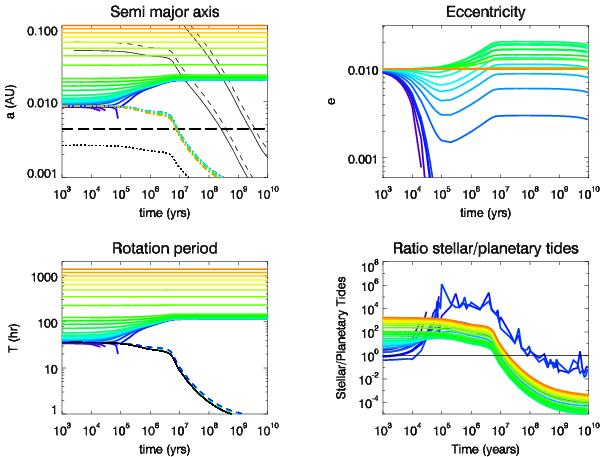
Tidal evolution of a Saturn mass planet starting at different initial semi-major axis around a 0.04 M⊙ BD. The first panel shows the evolution of the semi-major axis (bold solid lines). The dashed dotted line represent the radius of the BD, the dotted line the corotation radius and the bold dashed line the Roche limit. The habitable zone is also plotted. The second panel shows the evolution of the eccentricity. The third panel shows the evolution of the rotation period of planets (solid lines) and the BD (dashed lines). The solid black line represents the rotation period of the BD if its evolution is governed only by conservation of angular momentum. The fourth panel shows the ratio of stellar over planetary tides and the horizontal line is a ratio of 1.
Current usage metrics show cumulative count of Article Views (full-text article views including HTML views, PDF and ePub downloads, according to the available data) and Abstracts Views on Vision4Press platform.
Data correspond to usage on the plateform after 2015. The current usage metrics is available 48-96 hours after online publication and is updated daily on week days.
Initial download of the metrics may take a while.