Fig. 4
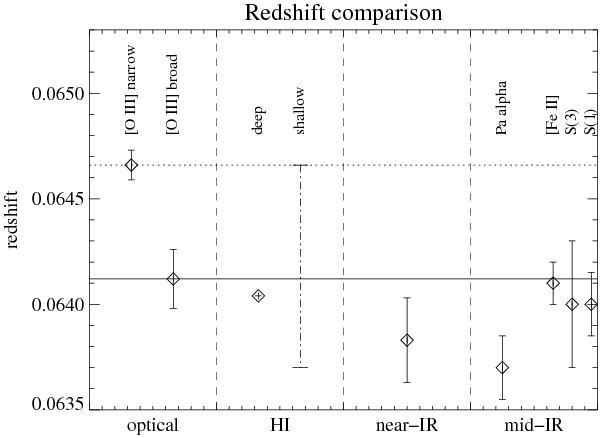
Comparison of the redshifts derived from the various observations. The horizontal lines represent the original (dotted; from Holt et al. 2008) and new (solid; this paper) interpretations of the systemic velocity. The vertical dot-dashed line labelled “shallow” marks the range of velocities over which the shallow H I absorption is observed (Morganti et al. 2001). The data are also summarised in Table 1.
Current usage metrics show cumulative count of Article Views (full-text article views including HTML views, PDF and ePub downloads, according to the available data) and Abstracts Views on Vision4Press platform.
Data correspond to usage on the plateform after 2015. The current usage metrics is available 48-96 hours after online publication and is updated daily on week days.
Initial download of the metrics may take a while.