Fig. 1
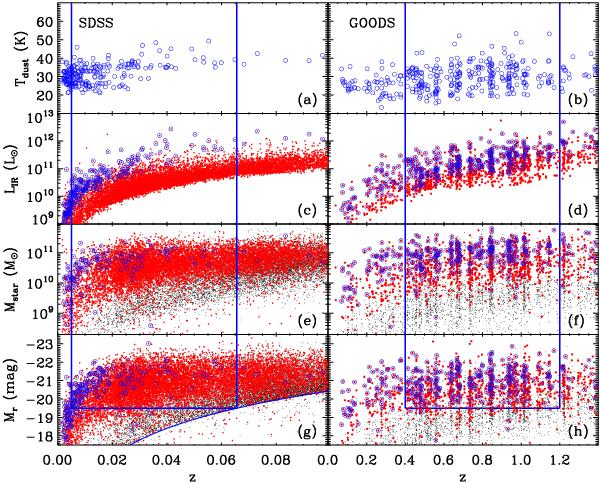
(a)–b)) Dust temperature (Tdust), (c)–d)) IR luminosity, (e)–f)) stellar mass, and (g)–h)) evolution-corrected, rest frame r-band absolute magnitude vs. spectroscopic redshift for galaxies in (left) SDSS and (right) GOODS. Red dots indicate FIR-selected galaxies. Black dots denote galaxies without FIR detection in the spectroscopic sample of galaxies (only 3 % of SDSS galaxies in the total sample are shown). Open blue circles denote galaxies with Tdust measurements. Blue solid lines in (g)–h)) define the volume-limited samples of SDSS galaxies at 0.005 ≤ z ≤ 0.0656 and of GOODS galaxies at 0.4 ≤ z ≤ 1.2, respectively. The bottom curve in (g) indicates the apparent magnitude limit (mr = 17.77) for the main galaxy sample in SDSS using the mean K-correction relation given by Eq. (2) of Choi et al. (2007).
Current usage metrics show cumulative count of Article Views (full-text article views including HTML views, PDF and ePub downloads, according to the available data) and Abstracts Views on Vision4Press platform.
Data correspond to usage on the plateform after 2015. The current usage metrics is available 48-96 hours after online publication and is updated daily on week days.
Initial download of the metrics may take a while.