Fig. 3
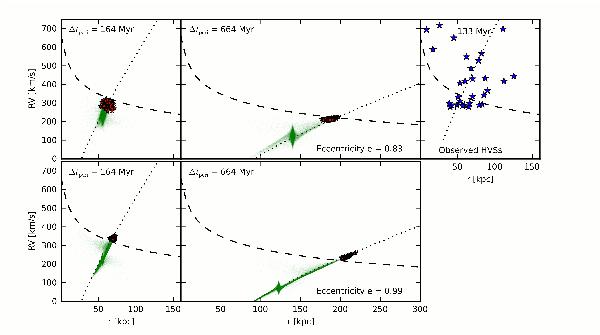
Time series of the galactocentric RV-distance plane for two simulation runs. The time elapsed since perigalacticon, Δtperi, is shown in the upper left corner. Red stars represent the MEPs, green dots satellite particles, and dashed lines the local escape speed of the respective radius. Dotted lines mark lines of constant travel times corresponding to Δtperi. The eccentricity of the satellite orbit is given in the lower right corner of the rightmost panel. In the leftmost panels the mean distance of the MEPs is 60 kpc similar to the observed HVS population, which is shown in the right most panel in the upper row for comparison. None of the simulations were designed to reproduce the observed HVS population.
Current usage metrics show cumulative count of Article Views (full-text article views including HTML views, PDF and ePub downloads, according to the available data) and Abstracts Views on Vision4Press platform.
Data correspond to usage on the plateform after 2015. The current usage metrics is available 48-96 hours after online publication and is updated daily on week days.
Initial download of the metrics may take a while.