Fig. 8
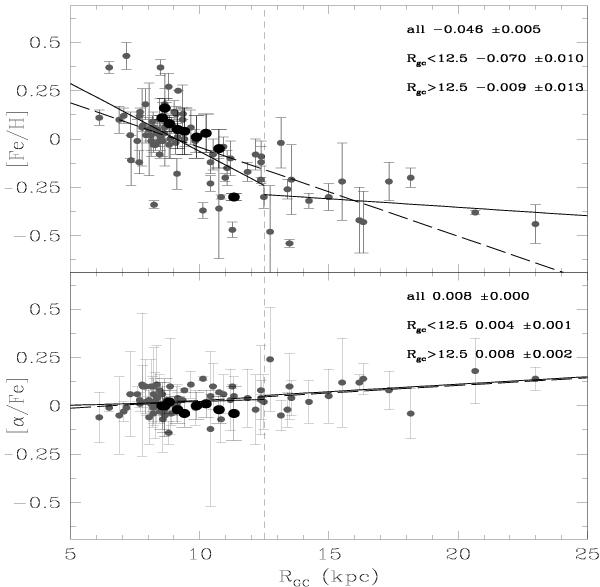
Trends of [Fe/H] (top panel) and [α/Fe] (bottom panel) with galactocentric radius. Grey dots are OC compiled in Table 12, while black dots are the ones analysed here and in Paper I. A global linear fit is drawn in both panels (long-dashed line). Two separate linear fits of OC inside and outside 12.5 kpc are also shown (solid lines).
Current usage metrics show cumulative count of Article Views (full-text article views including HTML views, PDF and ePub downloads, according to the available data) and Abstracts Views on Vision4Press platform.
Data correspond to usage on the plateform after 2015. The current usage metrics is available 48-96 hours after online publication and is updated daily on week days.
Initial download of the metrics may take a while.