Fig. 3
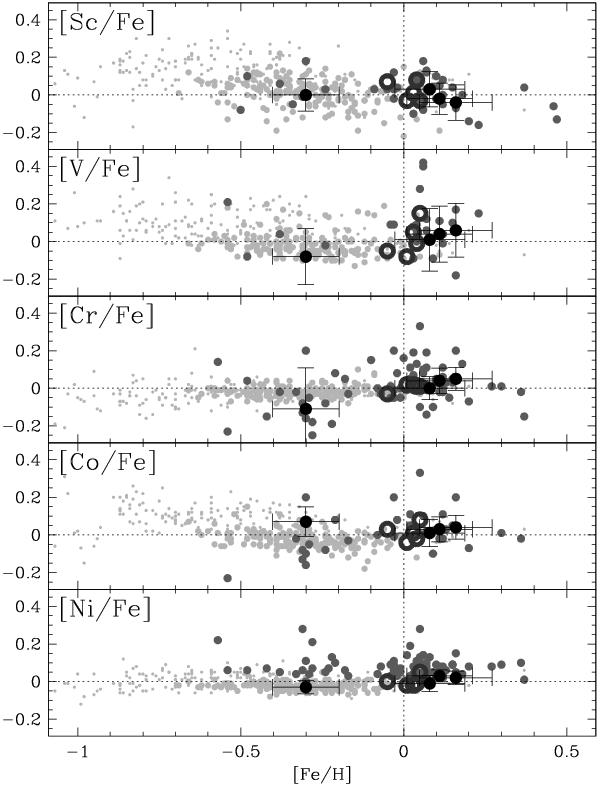
Comparison between our iron-peak abundance ratios (large black dots), those of Paper I (large black open circles), high-resolution measurements listed in Table 12 (large dark grey dots), field stars belonging to the thin disc (light grey dots, Reddy et al. 2003), and to the thick disc (tiny light grey dots, Reddy et al. 2006). Errorbars in our measurements are the quadratic sum of all uncertainties discussed in Sects. 3.2 and 3.3.
Current usage metrics show cumulative count of Article Views (full-text article views including HTML views, PDF and ePub downloads, according to the available data) and Abstracts Views on Vision4Press platform.
Data correspond to usage on the plateform after 2015. The current usage metrics is available 48-96 hours after online publication and is updated daily on week days.
Initial download of the metrics may take a while.