Fig. 5
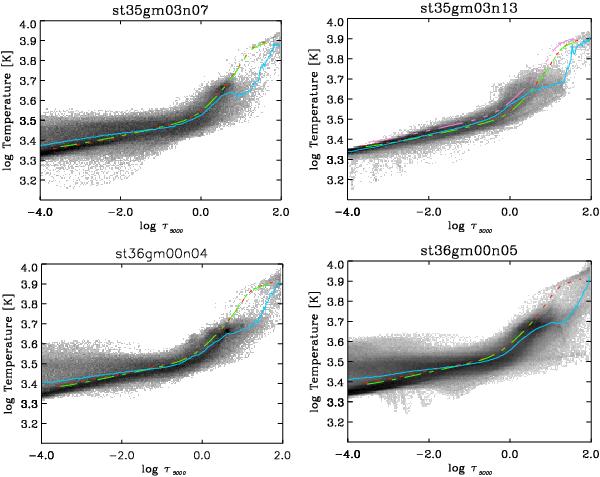
Thermal structures of the simulations in Table 1 as a function of the optical depth at λ = 5000 Å. Darker areas indicate temperature values with higher probability. The solid light blue curve is the average temperature, the red dashed line is the 1D MARCS model profile with surface gravity g (Table 2) and the green dotted-dashed line is the 1D MARCS model with surface gravity geff (see text). In the top right panel the 3D mean thermal profile is compared to a cool MARCS model at 3430 K for the outer layers and a hot one with 3700 K (magenta dotted-triple dashed line) for the continuum-forming region (see text).

Current usage metrics show cumulative count of Article Views (full-text article views including HTML views, PDF and ePub downloads, according to the available data) and Abstracts Views on Vision4Press platform.
Data correspond to usage on the plateform after 2015. The current usage metrics is available 48-96 hours after online publication and is updated daily on week days.
Initial download of the metrics may take a while.