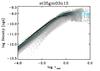
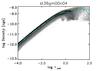
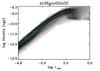
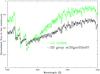
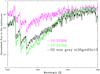
Fig. 3
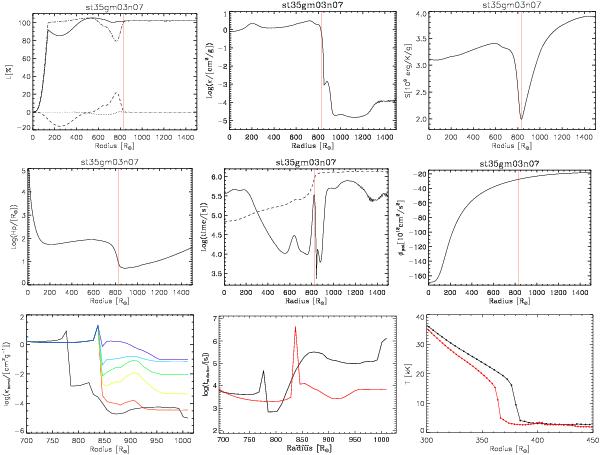
Some spatially average quantities (i.e., spherical shells) for a snapshot of st35gm03n07 (Table 1). The red vertical line is the location of the radius. Top row, left panel: luminosities as function of radius in solar radii: continuous curve is the total luminosity; the dashed curve is the luminosity owing to pressure work; the dotted curve is the luminosity of kinetic energy; and the dash-dotted curve is the radiative luminosity. Top row, center: opacity. Top row, right: specific entropy. Central row, left panel: pressure scale height. Central row, center: characteristic radiative (continuous line) and hydrodynamical (dotted line) time scales. Central row, right: gravitational potential Φpot. Bottom row, left panel: random column opacity and radiative time scale for a given snapshot of the gray model st35gm03n07 (black) and non-gray model st35gm03n13 (red). The five colored curves correspond to the opacity groups. The radiative time scale is estimated for temperature fluctuations with spatial scales on the order of the grid size. Bottom row, center: characteristic radiative time scale for the gray (black) and non-gray (red) models. Bottom row, right: temperature profiles for the st36g00n04 (2553 grid points, black) and st36g00n05 (4013 grid points, red).

Current usage metrics show cumulative count of Article Views (full-text article views including HTML views, PDF and ePub downloads, according to the available data) and Abstracts Views on Vision4Press platform.
Data correspond to usage on the plateform after 2015. The current usage metrics is available 48-96 hours after online publication and is updated daily on week days.
Initial download of the metrics may take a while.