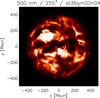
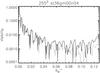
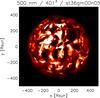
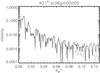
Fig. 12
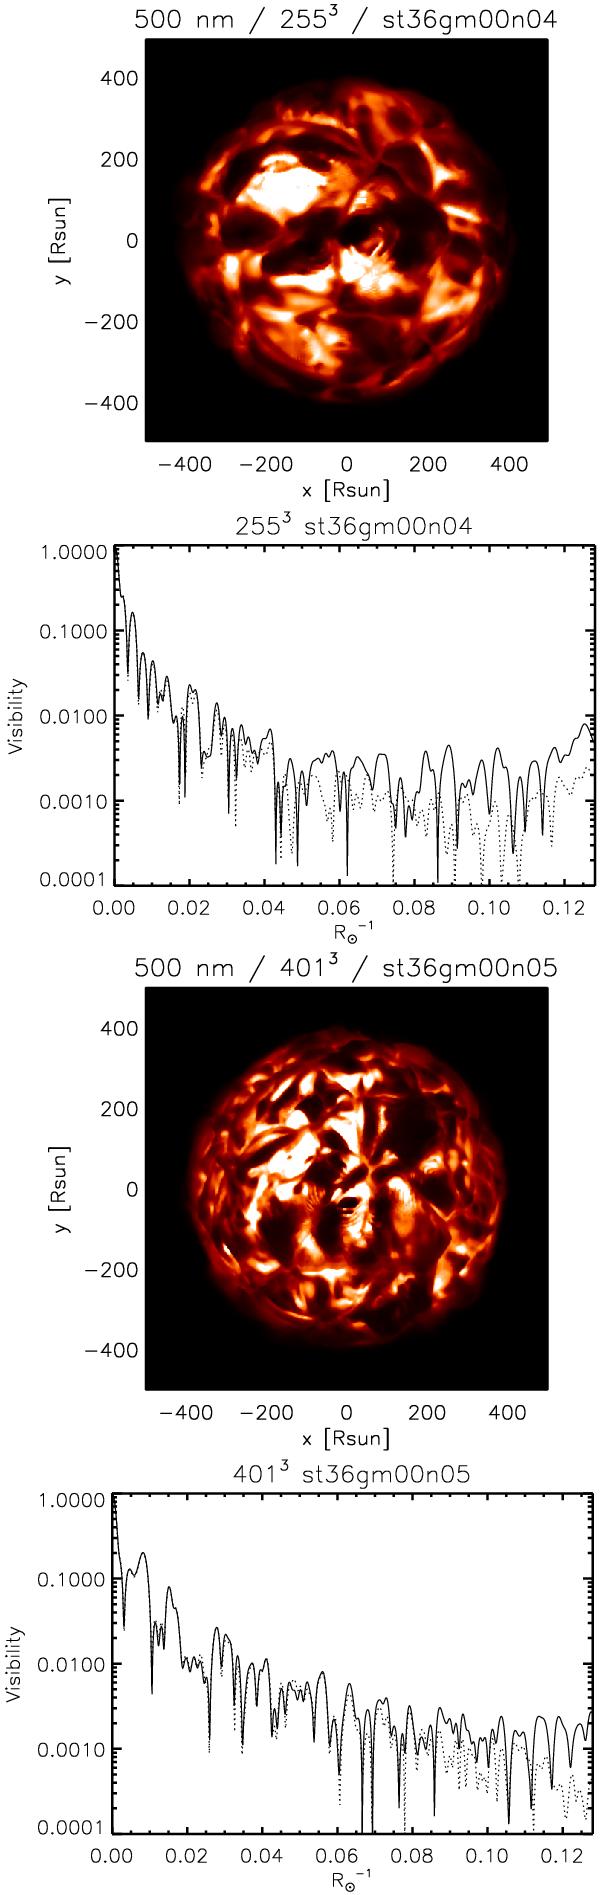
Maps of the square root intensity (to better show the structure in the higher resolution simulation) of st36gm00n04 and st36gm00n05 (Table 1) at 5000 Å together with a visibility curve extracted for a particular angle (solid curve) and the the same visibility’s angle after applying a [3 × 3] median smoothing (dashed curve). The intensity range in the maps is [0; 547.7] erg cm-2 s-1 Å-1.
Current usage metrics show cumulative count of Article Views (full-text article views including HTML views, PDF and ePub downloads, according to the available data) and Abstracts Views on Vision4Press platform.
Data correspond to usage on the plateform after 2015. The current usage metrics is available 48-96 hours after online publication and is updated daily on week days.
Initial download of the metrics may take a while.