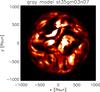
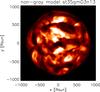
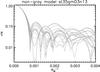
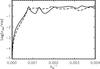
Fig. 11
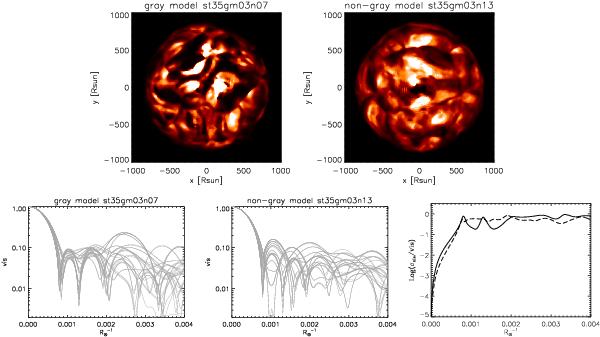
Top row: map of the linear intensity in the TiO band transition A3Φ − X3Δ(γ) of Fig. 10. The range is [0; 3.5 × 10⁵] for the gray simulation st35gm03n07 of Table 1 and [0; 4.5 × 10⁵] erg cm-2 s-1 Å-1 for the non-gray simulation st35gm03n13. Bottom row: visibility curves obtained from the maps above. The visibilities were computed for 36 different azimuth angles 5° apart. Bottom right panel: visibility fluctuations with respect to the average value for the gray (solid line) and non-gray (dashed line).
Current usage metrics show cumulative count of Article Views (full-text article views including HTML views, PDF and ePub downloads, according to the available data) and Abstracts Views on Vision4Press platform.
Data correspond to usage on the plateform after 2015. The current usage metrics is available 48-96 hours after online publication and is updated daily on week days.
Initial download of the metrics may take a while.