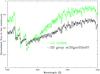
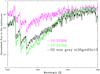
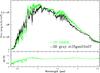
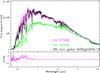
Fig. 10
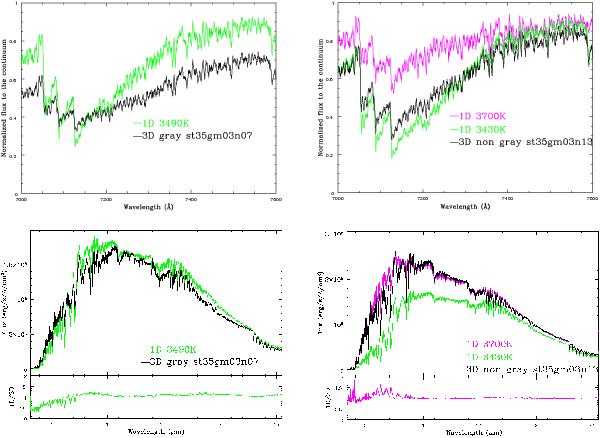
Top panel: spectral synthesis of TiO band transition A3Φ − X3Δ(γ) (top row) and spectral energy distribution (bottom row) for the same snapshots of the gray, st35gm03n07, and non-gray, st35gm03n13, simulations of Fig. 5. 3D spectra are compared to the corresponding 1D MARCS models (Table 2) with ξmic and ξmac from Table 4 (radial-tangential profile).
Current usage metrics show cumulative count of Article Views (full-text article views including HTML views, PDF and ePub downloads, according to the available data) and Abstracts Views on Vision4Press platform.
Data correspond to usage on the plateform after 2015. The current usage metrics is available 48-96 hours after online publication and is updated daily on week days.
Initial download of the metrics may take a while.