Fig. 8
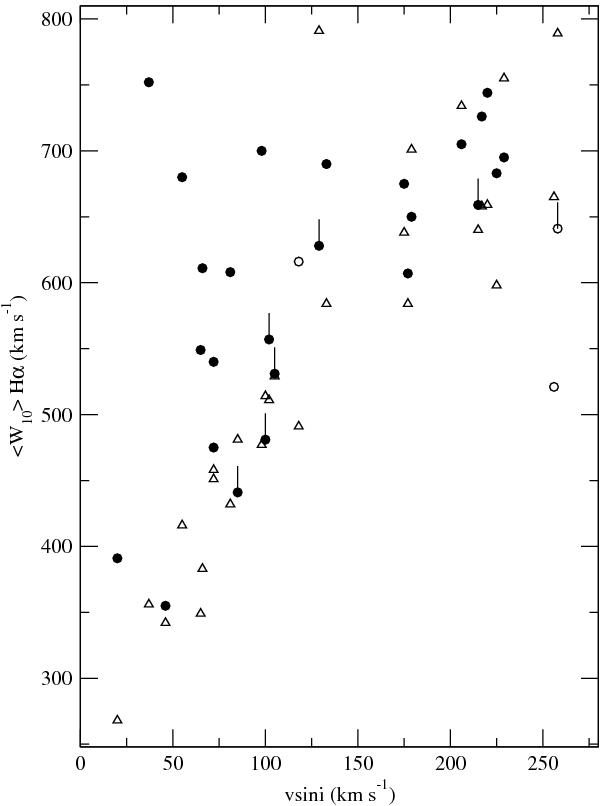
Hα mean line width at 10% of peak intensity (from Paper I) vs. the projected rotational velocities (circles). Lower limits for ⟨ W10(Hα) ⟩ are marked with vertical bars. Open circles indicate HBe stars – 51 Oph the object with the highest value of vsini –. Filled circles represent the stars in our sample with later spectral types. The theoretical lower limit estimates for each object are derived from Eq. (14), and are plotted as open triangles (see text).
Current usage metrics show cumulative count of Article Views (full-text article views including HTML views, PDF and ePub downloads, according to the available data) and Abstracts Views on Vision4Press platform.
Data correspond to usage on the plateform after 2015. The current usage metrics is available 48-96 hours after online publication and is updated daily on week days.
Initial download of the metrics may take a while.