Fig. 7
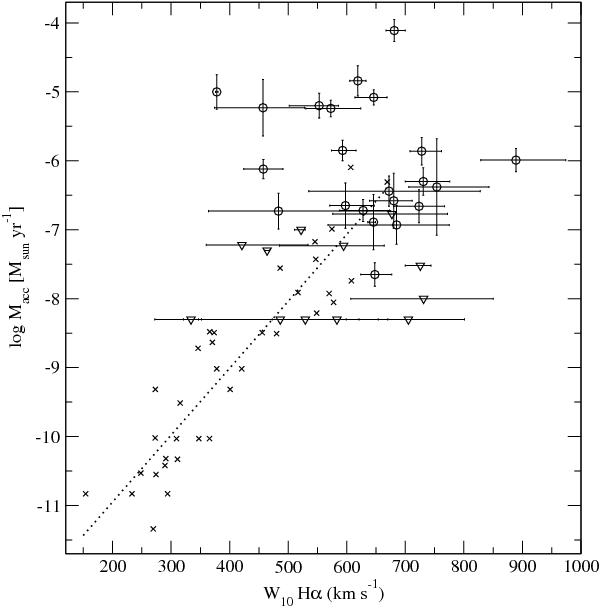
Mass accretion rate against the Hα 10% width. Our results are represented by circles, and triangles for the upper limits on the accretion rates. Error bars for the line widths indicate the uncertainties for the non-variable objects and variability amplitudes for the variable ones. Data for lower mass stars are also included (crosses; from the compilation of Natta et al. 2004), as well as the empirical expression relating both parameters in that stellar regime; log Ṁacc ~ –12.9 + 9.7 × 10⁻³W10(Hα) (dotted line; Natta et al. 2004).
Current usage metrics show cumulative count of Article Views (full-text article views including HTML views, PDF and ePub downloads, according to the available data) and Abstracts Views on Vision4Press platform.
Data correspond to usage on the plateform after 2015. The current usage metrics is available 48-96 hours after online publication and is updated daily on week days.
Initial download of the metrics may take a while.