Fig. 6
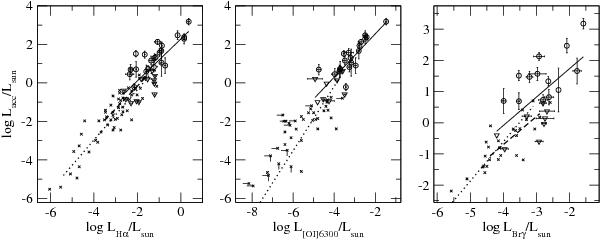
Accretion luminosity against the Hα (left), [O i]6300 (middle) and Brγ (right) luminosities. Our results are represented with circles and triangles for the upper limits on the accretion rates. Our accretion and Brγ luminosities were not derived from simultaneous measurements. Error bars for the line luminosities indicate the uncertainties for the non-variable objects and variability amplitudes for the variable ones. Our best fits are plotted with solid lines. Data for lower mass stars (crosses) were taken from Fang et al. (2009); Herczeg & Hillenbrand (2008), and Calvet et al. (2004), for the left, middle, and right panels, respectively. Upper limits are indicated with bars, when provided. Dotted and dashed lines are the empirical calibrations for Hα and Brγ in low and intermediate-mass CTT, respectively (see text).
Current usage metrics show cumulative count of Article Views (full-text article views including HTML views, PDF and ePub downloads, according to the available data) and Abstracts Views on Vision4Press platform.
Data correspond to usage on the plateform after 2015. The current usage metrics is available 48-96 hours after online publication and is updated daily on week days.
Initial download of the metrics may take a while.