Fig. 3
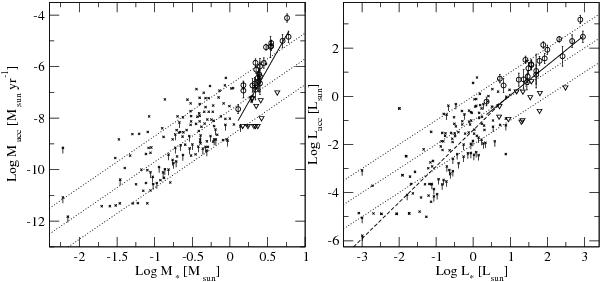
Mass accretion rate vs. stellar mass (left) and accretion luminosity vs. stellar luminosity (right). Our data are indicated with circles, and triangles for the upper limits on the accretion rates. Crosses are data from the literature (those with vertical bars are upper limits), including low-mass stars from different star-forming regions (see Natta et al. 2006, and references therein). Dotted lines indicate  dex (left) and Lacc/L∗ = 0.01, 0.1, 1 (right). The dashed line on the right side is the best fit for low-mass stars (Lacc ∝
  ), and the solid lines are the best fits for our sample (
 and Lacc ∝
  ).
).
Current usage metrics show cumulative count of Article Views (full-text article views including HTML views, PDF and ePub downloads, according to the available data) and Abstracts Views on Vision4Press platform.
Data correspond to usage on the plateform after 2015. The current usage metrics is available 48-96 hours after online publication and is updated daily on week days.
Initial download of the metrics may take a while.