Fig. 2
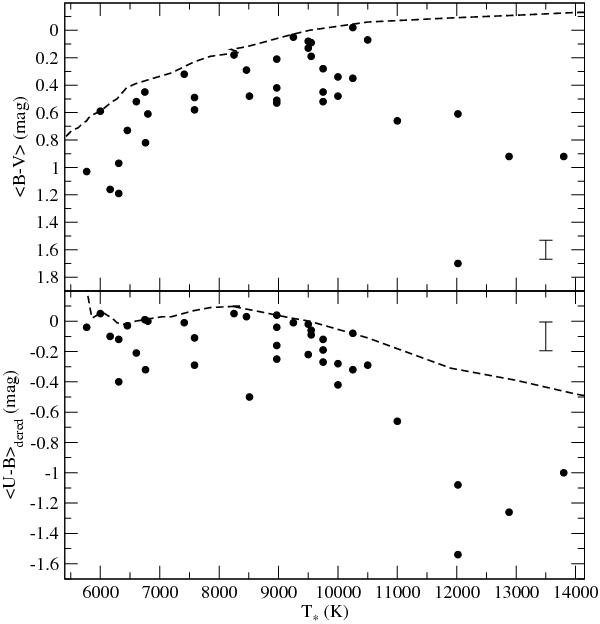
Observed mean colours in B − V (top) and U − B (bottom) as a function of the stellar temperature. The colours in the bottom panel are deredenned using the excesses derived from the top panel. The dashed lines indicate the corresponding intrinsic colours from Kenyon & Hartmann (1995). The typical error bars considering the photometric uncertainties are shown.
Current usage metrics show cumulative count of Article Views (full-text article views including HTML views, PDF and ePub downloads, according to the available data) and Abstracts Views on Vision4Press platform.
Data correspond to usage on the plateform after 2015. The current usage metrics is available 48-96 hours after online publication and is updated daily on week days.
Initial download of the metrics may take a while.