Fig. 1
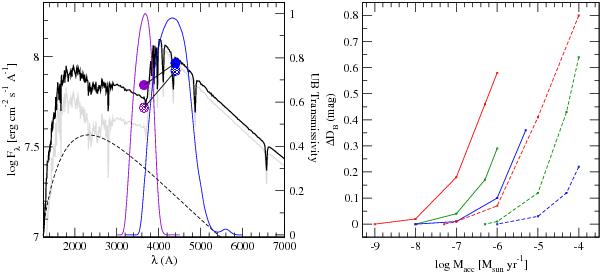
(Left) Photospheric flux (grey line), contribution from accretion (fF , dashed line) and total flux (solid black line) for M∗ = 2.5 M⊙, R∗ = 2.6 R⊙, T∗ = 9000 K, ℱ = 1012 erg cm-2 s-1 (Tcol = 12 470 K) and Ri = 2.5 R∗. The mass accretion rate is 5 × 10⁻⁷ M⊙ yr-1, (f = 0.084). All fluxes are computed at the stellar surface. The transmission curves of the U and B filters are plotted in violet and blue, respectively. The convolution of the fluxes with the filter responses provide the synthetic photometric points used to obtain the modelled photospheric and total colours (from the shaded and filled linked circles, respectively). (Right) Predicted excess in the Balmer discontinuity as a function of mass accretion rate for T∗ = 6500, 9000, and 12 500 K (red, green, and blue lines) and log g = 4.0 and 3.0 (solid and dashed lines). ℱ = 1012 erg cm-2 s-1 and Ri = 2.5 R∗ for all cases.
Current usage metrics show cumulative count of Article Views (full-text article views including HTML views, PDF and ePub downloads, according to the available data) and Abstracts Views on Vision4Press platform.
Data correspond to usage on the plateform after 2015. The current usage metrics is available 48-96 hours after online publication and is updated daily on week days.
Initial download of the metrics may take a while.