Fig. 8
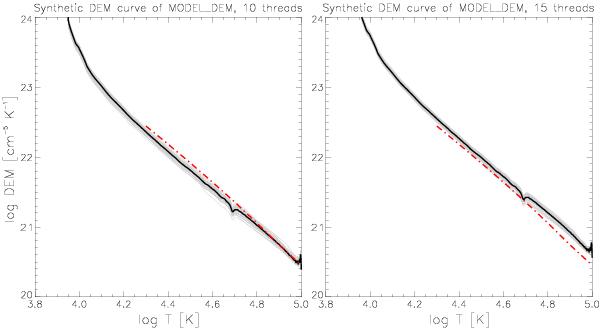
Synthetic DEM curves of the Model_dem in multi-thread configuration with 10 (left panel) and 15 threads (right panel). Gray solid lines represent 100 random realizations of the multi-thread model and the black solid line gives the average of these 100 realizations. Red dash-dotted line represents the observed DEM curve.
Current usage metrics show cumulative count of Article Views (full-text article views including HTML views, PDF and ePub downloads, according to the available data) and Abstracts Views on Vision4Press platform.
Data correspond to usage on the plateform after 2015. The current usage metrics is available 48-96 hours after online publication and is updated daily on week days.
Initial download of the metrics may take a while.