Fig. 5
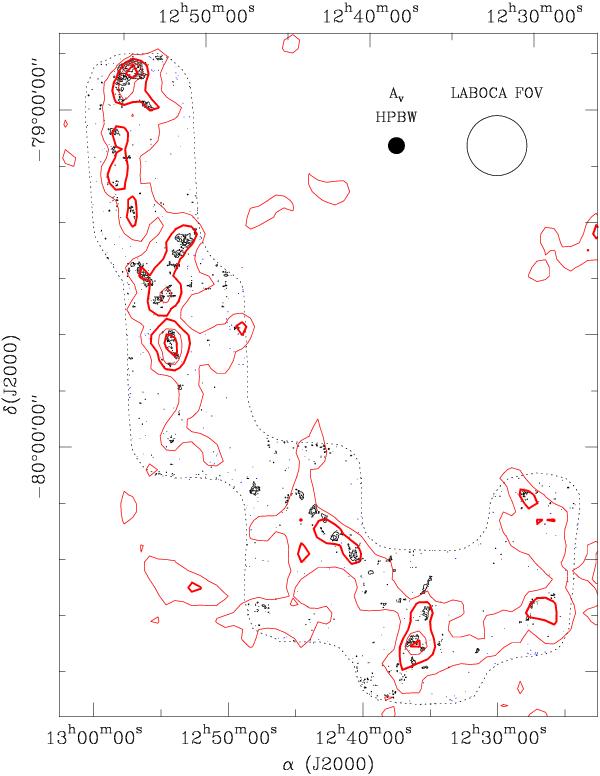
Extinction map of Fig. 1 (red contours) overlaid on the 870 μm continuum emission map of Cha III (black contours). The contour levels of the extinction map start at 3 mag and increase by steps of 1.5 mag. The thicker red contours correspond to AV = 4.5 and 7.5 mag. The contour levels of the 870 μm map are the same as in Fig. 2, plus a dotted blue contour at −a. The dotted line delimits the field mapped at 870 μm. The field of view of LABOCA and the angular resolution of the extinction map are shown in the upper right corner.
Current usage metrics show cumulative count of Article Views (full-text article views including HTML views, PDF and ePub downloads, according to the available data) and Abstracts Views on Vision4Press platform.
Data correspond to usage on the plateform after 2015. The current usage metrics is available 48-96 hours after online publication and is updated daily on week days.
Initial download of the metrics may take a while.