Fig. 4
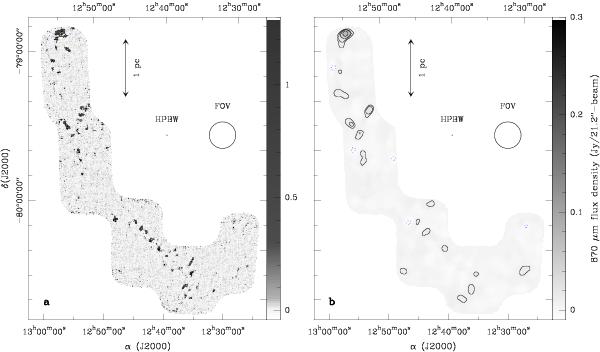
a) 870 μm continuum emission sum map of Cha III at scale 5. The contour levels are − a (in dotted blue), a, 2a, and 4a, with a = 34.5 mJy/21.2″-beam, i.e., about 3 times the rms noise level. b) Smoothed map, i.e., residuals, at scale 5. The contour levels are − c (in dotted blue), c, 2c, 4c, and 8c, with c = 8.1 mJy/21.2″-beam, i.e., about 3 times the rms noise level in this map. The grayscales of both maps are different. The sum of these two maps is strictly equal to the original map (Fig. 2).
Current usage metrics show cumulative count of Article Views (full-text article views including HTML views, PDF and ePub downloads, according to the available data) and Abstracts Views on Vision4Press platform.
Data correspond to usage on the plateform after 2015. The current usage metrics is available 48-96 hours after online publication and is updated daily on week days.
Initial download of the metrics may take a while.